Posts

Showing posts with the label Chianti

2018 April weather

Image
Daily temperature Max-Med-Min [°C] highest temp= 30,2 °C ( 86,4 °F ) lowest temp= 4 °C( 39,2 °F ) mean temp= 15,3 °C( 59,6°F ) mean of the max=22,8°C( 73,1°F ) mean of the min=8,1°C( 46,7°F ) Max temperature difference = 22,2°C( 40°F ) Mean temperature difference = 9,3°C( 26,4°F ) Daily rain [mm] Mean rain=1,98mm Total rain= 59,4 mm Daily humidity Max - Med - Min Mean humidity=67% Mean of the min=35% Mean Solar Radiation [W/m2] Mean value=204 W/m2

2017 July weather

Image
High temp days highlighted in red Daily temperature Max-Med-Min [°C] highest temp= 40 °C lowest temp=12,1°C mean temp= 25,2 °C mean of the max=34,1°C mean of the min=16,2°C Max temperature difference = 24,3 °C Mean temperature difference = 17,9°C Daily rain [mm] Mean rain=0,32mm Total rain=9,9mm Daily umidity Max - Med - Min Mean umidity=58% Mean of the min=28% Mean Solar Radiation [W/m2] Mean value=315 W/m2

2017 June weather

Image
High temp days highlighted in red Daily temperature Max-Med-Min [°C] highest temp= 36,7 °C  lowest temp= 10,2 °C mean temp= 24,1 °C mean of the max= 32,6 °C mean of the min=15,4 °C Max temperature difference =  21,8 °C Mean temperature difference = 16,6°C Daily rain [mm] Mean rain=1,43mm Total rain= 43 mm Daily umidity Max - Med - Min Mean umidity=60% Mean of the min=31% Mean Solar Radiation [W/m2] Mean value=319 W/m2

2017 April weather

Image
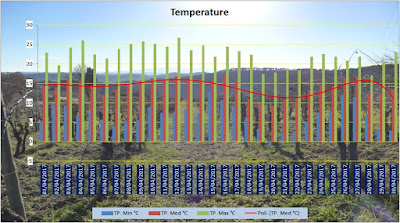
20, 21 and 22 night vines were frosted Daily temperature Max-Med-Min [°C] highest temp= 26,7 °C  lowest temp= -1 °C mean temp=14,0°C mean of the max=22,3°C mean of the min=6,6 °C Max temperature difference =  20,3 °C Mean temperature difference = 15,2°C Daily rain [mm] Mean rain=0,45mm Total rain=13,6mm Daily umidity Max - Med - Min Mean umidity=68% Mean of the min=36% Mean Solar Radiation [W/m2] Mean value=172 W/m2

Aprile 2017: il gelo colpisce le vigne

Image
E' arrivato il gelo sulla Vendemmia 2017 Il mese di Aprile si è presentato con temperature alte sia diurne che notturne ma nelle notti dei giorni 20 e 21 di Aprile si è avuto un crollo delle temperature durante la notte che ha portato la temperatura minima al di sotto degli 0°C per alcune ore. La stazione barometrica più vicina a San Gimignano ha rilevato le temperature minime sopra riportate ma le correnti gelide che hanno soffiato su alcune vigne hanno portato le temperature a valori inferiori a quelli rilevati. Soprattutto il crollo delle temperature minime ha sconvolto gli equilibri delle piante che ormai avevano iniziato da tempo la fase vegetativa. Sangiovese prima della gelata Questo ha contribuito a generare un elevato stress nei germogli delle viti portando alla necrosi e quindi a seccarsi le parti apicali, dove già si stavano formando i grappoli fiorali, ma in alcuni casi la morte vegetativa ha coinvolto tutta la parte aerea .  Sangiovese dopo ...

2017 March weather

Image
Daily temperature Max-Med-Min [°C] highest temp= 26,9 °C  lowest temp= 0,6 °C mean temp=12,2°C mean of the max=19,9°C mean of the min=5,3 °C Max temperature difference = 22,5 °C Mean temperature difference = 14,5°C Daily rain [mm] Mean rain=1,36mm Total rain=42,2mm Daily umidity Max - Med - Min Mean umidity=65% Mean of the min=36% Mean Solar Radiation [W/m2] Mean value=172 W/m2

2017 February weather

Image
Daily temperature Max-Med-Min [°C] highest temp=18,2°C  lowest temp= -0,9 °C mean temp=9,3°C mean of the max=15,3°C mean of the min= 4,4°C Max temperature difference = 18,3°C Mean temperature difference = 9,8°C Daily rain [mm] Mean rain=3,07mm Total rain=86,2mm Daily umidity Max - Med - Min Mean umidity=78% Mean of the min=53% Mean Solar Radiation [W/m2] Mean value=90 W/m2

2016 December weather

Image
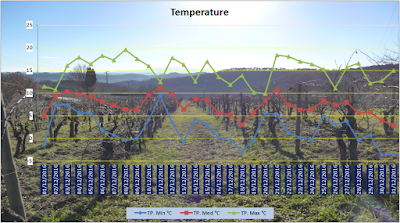
Daily temperature Max-Med-Min [°C] highest temp=19,6°C  lowest temp=-3,6°C mean temp=7,3°C mean of the max=15°C mean of the min=2,1 Daily rain [mm] Mean rain=0,25mm Total rain=8mm Daily umidity Max - Med - Min Mean umidity=84% Mean of the min=55% Mean Solar Radiation [W/m2] Mean value=65 W/m2

2016 weather summary

Image
The monthly temperature of 2016 on our vineyards in San Gimignano The monthly rain 2016 total rain was 807,4 mm

2016 October weather

Image
Daily temperature Max-Med-Min [°C] highest temp=26,9°C mean temp=15,1°C lowest temp=3,5°C Daily rain [mm] Mean rain=4,6mm Total rain=143,8mm Mean Solar Radiation [W/m2] Mean value=115 W/m2 Daily umidity Max - Med - Min Mean umidity=82%

2016 September weather

Image
Daily temperature Max-Med-Min [°C] highest temp=35,6°C mean temp=20,8°C lowest temp=9,3°C Daily rain [mm] Mean rain=4,1mm Total rain=123mm Mean Solar Radiation [W/m2] Mean value=180 W/m2 Daily umidity Max - Med - Min Mean umidity=71,2%

2016 August weather

Image
Daily temperature Max-Med-Min [°C] highest temp=36,3°C mean temp=24,3°C lowest temp=9,9°C Daily rain [mm] Mean rain=0,99mm Total rain=30,7mm Mean Solar Radiation [W/m2] Mean value=261 W/m2 Daily umidity Max - Med - Min Mean umidity=57,6%