Posts

Showing posts from 2021

2021 April weather

Image
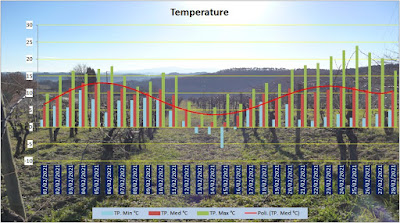
  Daily temperature Max-Med-Min [°C] highest temp=24,6 °C ( 76,3 °F ) lowest temp= -4,5 °C( 23,9 °F ) mean temp=11,2 C( 52,2°F ) mean of the max=18,5°C( 65,3°F ) mean of the min=4,3°C( 39,8°F )     Max temperature difference = 20,8°C( 36,7°F ) Mean temperature difference = 14,1°C( 25,5°F )    Daily rain [mm] Mean rain=2,09mm Total rain= 62,8 mm    Daily humidity Max - Med - Min Mean humidity=69,9% Mean of the min=44,8%      Mean Solar Radiation [W/m2] Mean value=180,6W/m2  

2021 March weather

Image
   Daily temperature Max-Med-Min [°C] highest temp=27,7 °C ( 81,9 °F ) lowest temp= -3,7 °C( 25,3 °F ) mean temp=9,3 C( 48,8°F ) mean of the max=17,5°C( 63,7°F ) mean of the min=1,8°C( 35,3°F )     Max temperature difference = 22,8°C( 41°F ) Mean temperature difference = 15,7°C( 28,3°F )     Daily rain [mm] Mean rain=0,4mm Total rain= 12,4 mm      Daily humidity Max - Med - Min Mean humidity=66% Mean of the min=36%      Mean Solar Radiation [W/m2] Mean value=177W/m2

2021 February weather

Image
   Daily temperature Max-Med-Min [°C] highest temp= 23,9 °C (75 °F ) lowest temp= -6,1 °C( 21,0 °F ) mean temp= 8,9 C( 48°F ) mean of the max=14,7°C( 58,6°F ) mean of the min=3,9°C( 39,2°F ) Max temperature difference = 21,1°C( 38,2°F ) Mean temperature difference = 10,7°C( 19,4°F )     Daily rain [mm] Mean rain=2,76mm Total rain= 77,4 mm     Daily humidity Max - Med - Min Mean humidity=81,5% Mean of the min=57,7%    Mean Solar Radiation [W/m2] Mean value=95,9W/m2

2021 January weather

Image
   Daily temperature Max-Med-Min [°C] highest temp= 16,8 °C ( 62,2 °F ) lowest temp= -4,7 °C( 23,5 °F ) mean temp= 5,9 C( 42,6°F ) mean of the max=10,6°C( 51°F ) mean of the min=1,9°C( 35,6°F )   Max temperature difference = 17,3°C( 31,1°F ) Mean temperature difference = 8,6°C( 15,6°F )       Daily rain [mm] Mean rain=3,65mm Total rain= 113,2 mm       Daily humidity Max - Med - Min Mean humidity=84,2% Mean of the min=64,5%    Mean Solar Radiation [W/m2] Mean value=54,5W/m2

2020 weather summary

Image
2020 temperature in San Gimignano   Mild March and April allowed an early budding damaged by low temperature. A very hot summer reduced quantity,  July and August had max temp over 35°C that stressed vines. The first decade of September was very hot and dry increasing sugar and reducing quantity. 2020 rain  Total rain=787mm Compared to 2019 it is 23% less Compared to 2018 it is 16% less Compared to 2017 it is 42% more Comparison between last 6 years temperature      

2020 December weather

Image
   Daily temperature Max-Med-Min [°C] highest temp= 18,5 °C ( 65 °F ) lowest temp= -0,8 °C( 30,6 °F ) mean temp= 7,4 °C( 45,4°F ) mean of the max=12,2°C( 54°F ) mean of the min=3,7°C( 38,7°F )   Max temperature difference = 17,3°C( 31,1°F ) Mean temperature difference = 8,5°C( 15,3°F )   Daily rain [mm] Mean rain=4,9mm Total rain= 152,6 mm Daily humidity Max - Med - Min Mean humidity=93,1% Mean of the min=76,4%   Mean Solar Radiation [W/m2] Mean value=43,4W/m2